@financial_nirvana · Instagram Library

Every reel's keyword, fully answered 📚

Newest answer on top. Search your keyword (e.g. DIVIDEND) and tap "Show full answer".

No answer for this keyword yet. Ask in the reel's comments and I'll reply.

Which Nifty 50 companies paid a dividend every single year? (Yahoo record, FY1997 - FY2026)▶
DIVIDEND20 Nov 2026

Which Nifty 50 companies paid a dividend every single year? (Yahoo record, FY1997 - FY2026)

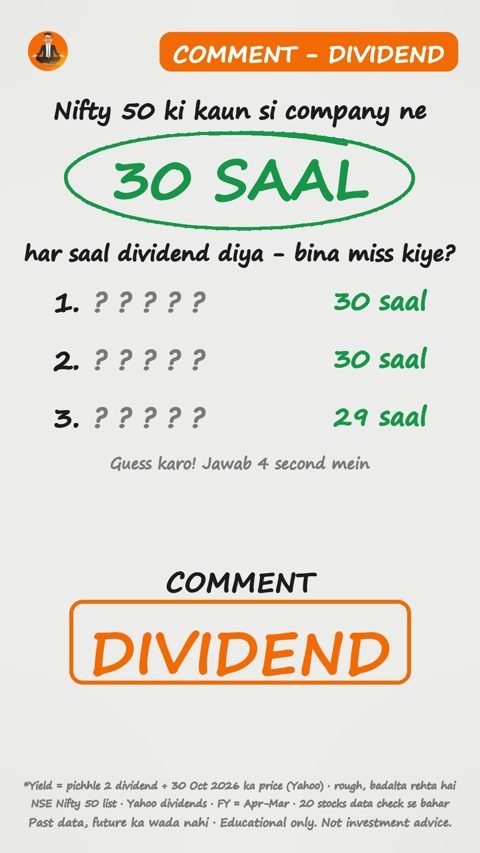
The reel asked: which Nifty 50 company paid a dividend every year for 30 years, without missing one? The answer from Yahoo's dividend record: Infosys and ITC (30 years each), then Hindustan Unilever (HUL) (29 years).

▶ Watch reel

The reel asked: which Nifty 50 company paid a dividend every year for 30 years, without missing one? The answer from Yahoo's dividend record: Infosys and ITC (30 years each), then Hindustan Unilever (HUL) (29 years).

30 years (FY1997 - FY2026)Infosys
30 years (FY1997 - FY2026)ITC
29 years (FY1998 - FY2026)Hindustan Unilever (HUL)
10 of 30Paid every year for the last 20 years
16 of 30Paid every year for the last 10 years

The method

  • Companies: the 50 stocks in the Nifty 50 list from NSE (fetched 20 Nov 2026).
  • Dividends: the full dividend history in Yahoo Finance for each stock (ex-dates and amounts).
  • Year: the Indian financial year, April to March. FY2026 = April 2025 to March 2026.
  • Streak: start at FY2026 and count back while every year has at least one dividend. The first year with no dividend ends the streak.
  • Data check: a stock is removed if its price ever fell more than 30% in one day with no split recorded (a sign of a missing bonus, split or demerger). 20 stocks were removed this way, so 30 were checked.
Longest dividend streaks among the checked Nifty 50 stocks (dividend per share as Yahoo reports it, split/bonus-adjusted)
CompanyYears in a rowSinceDividend FY2016Dividend FY2026Growth
Infosys30FY1997₹12.38₹453.64x
ITC30FY1997₹4.17₹14.353.44x
Hindustan Unilever (HUL)29FY1998₹15.5₹432.77x
Tata Consumer27FY2000₹2.22₹8.253.71x
Asian Paints24FY2003₹6.5₹25.053.85x
HCL Tech24FY2003₹10₹545.4x
Shriram Finance24FY2003₹1.95₹7.84.0x
L&T22FY2005₹10.83₹343.14x
Maruti Suzuki22FY2005₹25₹1355.4x
NTPC22FY2005₹2.79₹8.853.17x
Power Grid19FY2008₹1.19₹97.58x
JSW Steel18FY2009₹1.1₹2.82.55x
Sun Pharma18FY2009₹3₹16.55.5x
Coal India16FY2011₹27.4₹26.40.96x
Tech Mahindra16FY2011₹6₹457.5x
BSE10FY2017-₹7.67-

3 lessons from the data

  1. A long streak is rare. Only 10 of the 30 checked companies paid a dividend in every one of the last 20 years. 16 managed the last 10.
  2. The best payers also raised the dividend. From FY2016 to FY2026, the dividend per share grew 3.64x at Infosys, 3.44x at ITC and 2.77x at Hindustan Unilever (HUL). A steady payer usually pays from steady cash flow.
  3. Big names do skip. HDFC Bank paid nothing in FY2021, when the RBI asked banks to keep their profits in 2020. Banks and cyclical companies break streaks more often than consumer and IT companies.
Checked companies that skipped at least one year between FY2017 and FY2025
CompanyYear(s) with no dividendCurrent streak (years)
Apollo HospitalsFY20179
TitanFY20179
Adani PortsFY2017, FY20215
HDFC BankFY20215
HDFC LifeFY2020, FY20215
ICICI BankFY20215
SBI LifeFY20215
SBIFY2019, FY2020, FY20215
Axis BankFY2019, FY2021, FY20224
Bharti AirtelFY2020, FY20224
IndiGoFY2021, FY2022, FY2023, FY2024, FY20251

The traps

  • A dividend streak is not a return. It says the company kept paying. It says nothing about how the share price did.
  • The record has a start. Yahoo's dividend data begins in the late 1990s. A streak that reaches that first year may really be longer, so treat it as "at least".
  • Special dividends inflate one year. A one-time special payout makes the growth figure look bigger than the regular dividend.
  • High yield can be a trap. A high dividend yield sometimes comes from a falling share price, not a rising dividend (see the DIVIDEND card from 18 Nov).
  • Removed stocks. M&M, ONGC also show 29+ years in Yahoo, but they failed the data check, so they are not in the table.

This is a past study of dividend records, not a list of stocks to buy. A company can cut or stop its dividend at any time.

⚠️ Past dividends are not a promise of future dividends or of share price returns. Companies can cut or skip a dividend, as HDFC Bank did in FY2021.

Data: NSE Nifty 50 list (fetched 20 Nov 2026); Yahoo Finance dividend and split history (FY1997 - FY2026, financial years April-March). 20 stocks removed by the split/demerger check; 30 checked.
🔗 Link to this answer

Tata Teleservices: ₹1 lakh to ₹1.61 crore then down 86%: 3 questions before buying a share for its name▶
TATA19 Nov 2026

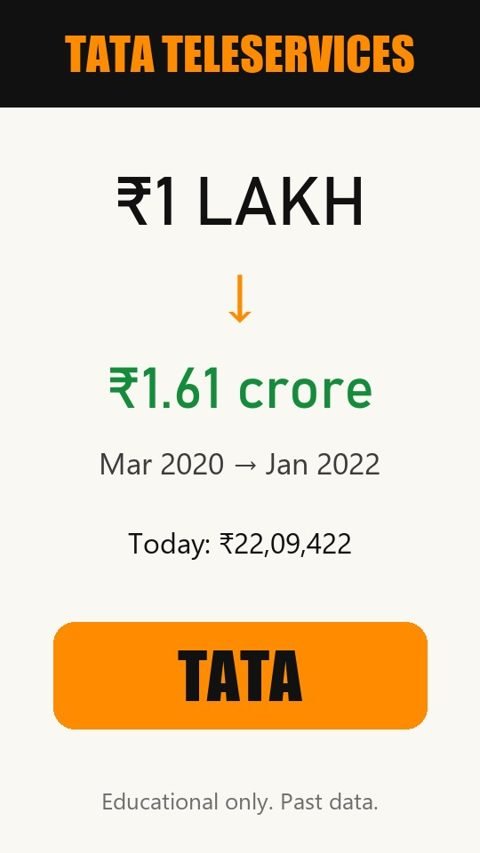
Tata Teleservices: ₹1 lakh to ₹1.61 crore then down 86%: 3 questions before buying a share for its name

₹1 lakh in Mar 2020 reached ₹1,61,19,283 at its 2y peak (Jan 2022); on 06 Nov 2026 it was ₹22,09,422. Full working + 3 questions before buying a share just for the group name.

▶ Watch reel

The reel told the Tata Teleservices (Maharashtra) story: an old Tata group telecom company whose mobile business had already shut down; today it serves business customers. Below is the full working and the 3 questions from the pinned comment, explained. Data: 31 Mar 2020 to 06 Nov 2026.

31 Mar 2020 at ₹1.80Bought
55,555 shares₹1 lakh bought
₹1,61,19,283 (161x, 11 Jan 2022)Peak value in the 2y window
NoneDividends received
₹22,09,422 (-86% from that peak)Value on 06 Nov 2026

The journey of ₹1 lakh

When the ₹1 lakh crossed each level
LevelDateMonths after buying
₹2 lakh09 Jun 20203
₹5 lakh11 Jan 202110
₹10 lakh02 Feb 202111
₹25 lakh01 Jul 202116
₹50 lakh24 Nov 202120
₹1 crore16 Dec 202121
Key points
PointDateShare priceValue of the ₹1 lakh
Buy31 Mar 2020₹1.80₹1,00,000
Peak in the 2y window (the reel)11 Jan 2022₹290.15₹1,61,19,283
Lowest after that high30 Mar 2026-₹17,42,205
Latest in our data06 Nov 2026₹39.77₹22,09,422

3 lessons from this story

  1. A famous name does not stop a fall. The price ran up on the Tata name, 5G and enterprise-business talk, and the company paid no dividend at all. The fall afterwards was just as dramatic.
  2. The ride was rough. From the high of ₹1,61,19,283 (11 Jan 2022) the value fell to ₹17,42,205 by 30 Mar 2026: -89%. The worst single day was -9.6% (20 Jun 2022).
  3. Compare with a safe option. The same ₹1 lakh in a 7% FD would be about ₹1,56,301 after 6.6 years. This story paid no dividend at all.

3 questions before buying a share just for the group name

  1. Is the company itself earning, or is it only the group name? A big name on the label does not mean this company makes a profit.
  2. How much debt does it carry? Check the borrowings in the balance sheet. Heavy debt with little income is a warning, whatever the name.
  3. What replaced the business that closed? When the main business is sold or shut, ask what the company now does to earn money.

⚠️ This is an old story with past data, picked after the fact. It is not a promise about the future and not a recommendation to buy, sell or hold this stock.

Data: Yahoo Finance daily prices for TTML.NS (split-adjusted; raw prices rebuilt from split events) and dividend events, 31 Mar 2020 to 06 Nov 2026. ₹1,00,000 at that day's close, whole shares only. FD at 7% a year, compounded. Split/demerger check passed.

🔗 Link to this answer

Should you stop your SIP when the market crashes? Vishal vs Amit, 2010 - 2026▶
SIP19 Nov 2026

Should you stop your SIP when the market crashes? Vishal vs Amit, 2010 - 2026

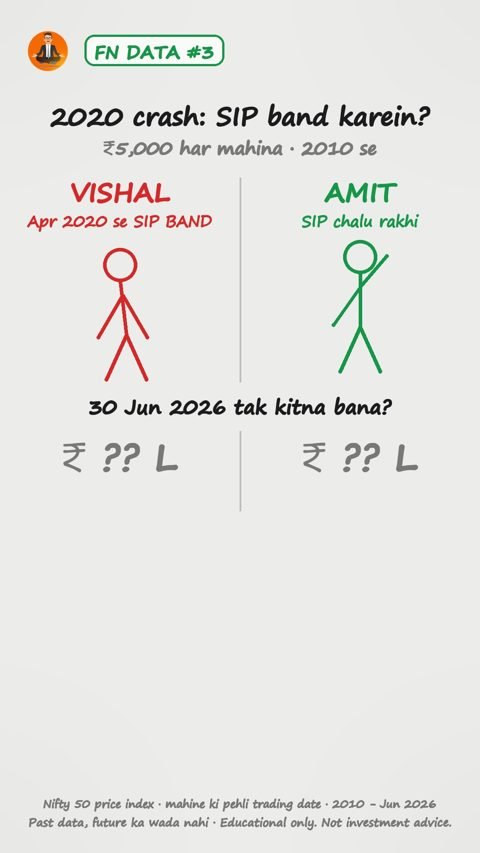
The reel asked: two friends run a ₹5,000 monthly SIP in the Nifty 50 from January 2010. In the March 2020 crash, Vishal stops his SIP from April 2020 (he keeps the units he already has). Amit keeps going. What did each have on 30 Jun 2026?

▶ Watch reel

The reel asked: two friends run a ₹5,000 monthly SIP in the Nifty 50 from January 2010. In the March 2020 crash, Vishal stops his SIP from April 2020 (he keeps the units he already has). Amit keeps going. What did each have on 30 Jun 2026?

₹6.15 LVishal: invested
₹20.32 LVishal: value on 30 Jun 2026
₹9.90 LAmit: invested
₹25.34 LAmit: value on 30 Jun 2026

The method

  • Each month: ₹5,000 buys Nifty units at the close of the first trading day of the month. Units = ₹5,000 ÷ Nifty close.
  • Value: total units × the Nifty close on 30 Jun 2026 (23,865.75).
  • Amit: all 198 instalments (Jan 2010 - Jun 2026). Vishal: the first 123 (Jan 2010 - Mar 2020), then nothing.
  • Price index only: dividends, fund costs and tax are not included. A real index fund would differ a little.

3 lessons from the data

  1. The gap is exactly the instalments Vishal skipped. Amit's 75 extra instalments (₹3.75 L) were worth ₹5.02 L on 30 Jun 2026. Even a one-year pause (Apr 2020 - Mar 2021, 12 instalments, ₹60,000) would have missed ₹1.27 L.
  2. Crash-time instalments bought cheaper than what came after. The 12 instalments from Apr 2020 to Mar 2021 bought the Nifty at an average of 11,277. Every instalment after that (Apr 2021 - Jun 2026) paid an average of 20,040. (The older 2010 - Mar 2020 instalments paid 7,225, because the Nifty was lower in those years.)
  3. A higher multiple does not mean more money. Vishal's money grew 3.3x and Amit's 2.56x, because Vishal's money is all old money with more years to grow. But Amit ended with ₹5.02 L more.
Year by year: what each had (value at the year's last close)
DateNifty closeVishal investedVishal valueAmit investedAmit value
31 Dec 201912,168.45₹6,00,000₹10,20,153₹6,00,000₹10,20,153
31 Dec 202013,981.75₹6,15,000₹11,90,161₹6,60,000₹12,49,931
31 Dec 202117,354.05₹6,15,000₹14,77,220₹7,20,000₹16,17,807
30 Dec 202218,105.30₹6,15,000₹15,41,168₹7,80,000₹17,50,774
29 Dec 202321,731.40₹6,15,000₹18,49,831₹8,40,000₹21,71,259
31 Dec 202423,644.80₹6,15,000₹20,12,704₹9,00,000₹24,22,795
31 Dec 202526,129.60₹6,15,000₹22,24,216₹9,60,000₹27,41,729
30 Jun 202623,865.75₹6,15,000₹20,31,512₹9,90,000₹25,33,619

The traps

  • SIP does not stop a fall. From 14 Jan 2020 to 23 Mar 2020, Amit's portfolio fell 37.8%. On 23 Mar 2020 it was still +5.3% above what he had put in, only because he had 10 years of SIP behind him.
  • Hindsight is easy. In March 2020 nobody knew how long the fall would last. The 2020 recovery was fast; another crash can take years to recover.
  • Stopping is not the same as selling. Vishal kept his units, so his money still grew. Selling in the crash would have locked in the loss.

This is a past study of the Nifty 50 index, not advice to start, stop or continue any SIP. Check your own goals and fund before you decide.

⚠️ Past data is not a promise about the future. The next crash may fall deeper or recover more slowly. Dividends, fund costs and tax are not included.

Data: Nifty 50 price index daily close (Yahoo Finance, project file nifty50.csv), Jan 2010 - 30 Jun 2026. ₹5,000 at the close of the first trading day of each month (198 months); value at the 30 Jun 2026 close of 23,865.75.

🔗 Link to this answer

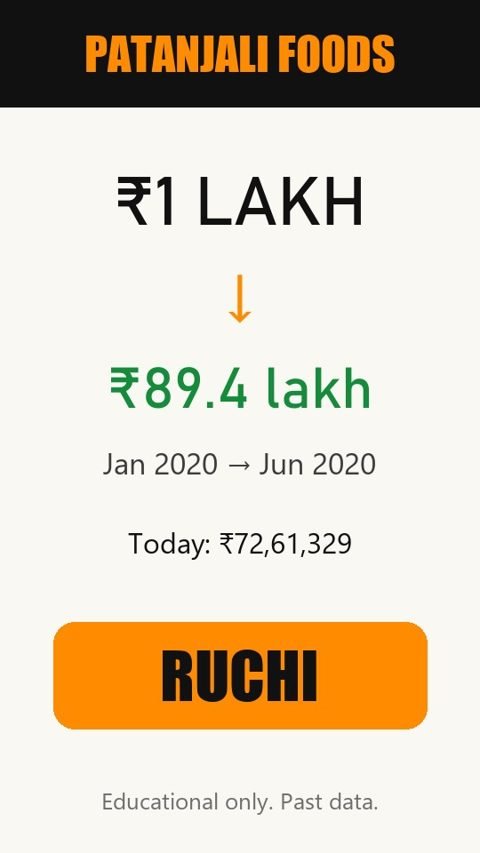
Patanjali Foods: ₹1 lakh to ₹89.4 lakh - why almost nobody could buy it (free float explained)▶
RUCHI19 Nov 2026

Patanjali Foods: ₹1 lakh to ₹89.4 lakh - why almost nobody could buy it (free float explained)

₹1 lakh in Jan 2020 reached ₹89,38,581 at its 1y peak (Jun 2020); on 06 Nov 2026 it was ₹72,61,329. Full working + free float: what it is and why it matters.

▶ Watch reel

The reel told the Patanjali Foods (earlier Ruchi Soya) story: the edible-oil company Ruchi Soya, bought out of insolvency by Patanjali, later renamed Patanjali Foods. Below is the full working and the 3 questions from the pinned comment, explained. Data: 27 Jan 2020 to 06 Nov 2026.

27 Jan 2020 at ₹17.00Bought
5,882 shares₹1 lakh bought
17,646 sharesShares after split(s)
₹89,38,581 (89x, 26 Jun 2020)Peak value in the 1y window
₹2,61,161 (8 payouts)Dividends received
₹72,61,329 (-19% from that peak)Value on 06 Nov 2026

The journey of ₹1 lakh

When the ₹1 lakh crossed each level
LevelDateMonths after buying
₹2 lakh11 Feb 20201
₹5 lakh11 Mar 20202
₹10 lakh31 Mar 20202
₹25 lakh04 May 20204
₹50 lakh11 Jun 20205
₹1 crore29 Jul 202454
Key points
PointDateShare priceValue of the ₹1 lakh
Buy27 Jan 2020₹17.00₹1,00,000
Peak in the 1y window (the reel)26 Jun 2020₹1,519.65₹89,38,581
Highest value ever16 Apr 2025₹2,000.80₹1,17,68,706
Lowest after that high24 Sep 2020-₹24,99,850
Latest in our data06 Nov 2026₹411.50₹72,61,329

Splits: 11 Sep 2025: 3:1 split (each share became 3). 5,882 shares became 17,646. The price falls by the same ratio on the split day, so the value does not change. All prices here are the real traded prices.

3 lessons from this story

  1. A return you cannot get is not a real chance. The share kept hitting the upper limit, and very few shares changed hands. The headline multiple looks great, but almost nobody could buy in at the start.
  2. The ride was rough. From the high of ₹1,17,68,706 (16 Apr 2025) the value fell to ₹24,99,850 by 24 Sep 2020: -79%. The worst single day was -14.9% (04 Jun 2024).
  3. Compare with a safe option. The same ₹1 lakh in a 7% FD would be about ₹1,58,165 after 6.8 years. Dividends of ₹2,61,161 came on top of the share value.

Free float: what it is and why it matters

  1. Free float = the shares actually available to trade. After the insolvency deal, very few of Ruchi Soya's shares were left with the public, so very few could be bought on the exchange.
  2. Low free float makes the price jump. Small buying hits a tiny supply, so the price can hit upper circuit day after day - and your buy order may simply not get filled.
  3. Judge liquidity, not just return. A huge return on paper means little if you could not buy (or sell) at that price. Check traded volume and how many shares are with the public.

⚠️ This is an old story with past data, picked after the fact. It is not a promise about the future and not a recommendation to buy, sell or hold this stock.

Data: Yahoo Finance daily prices for PATANJALI.NS (split-adjusted; raw prices rebuilt from split events) and dividend events, 27 Jan 2020 to 06 Nov 2026. ₹1,00,000 at that day's close, whole shares only. FD at 7% a year, compounded. Split/demerger check passed.

🔗 Link to this answer

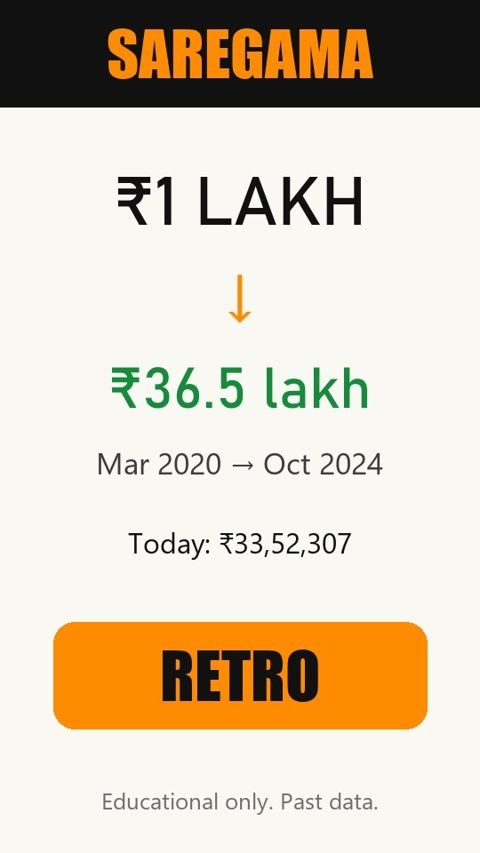
Saregama: ₹1 lakh to ₹36.5 lakh and 3 questions to study a content company▶
RETRO18 Nov 2026

Saregama: ₹1 lakh to ₹36.5 lakh and 3 questions to study a content company

₹1 lakh in Mar 2020 reached ₹36,49,315 at its 5y peak (Oct 2024); on 06 Nov 2026 it was ₹33,52,307. Full working + 3 questions to study any music or content company.

▶ Watch reel

The reel told the Saregama story: the music label that owns a huge catalogue of old Hindi songs (and the Carvaan player). Below is the full working and the 3 questions from the pinned comment, explained. Data: 30 Mar 2020 to 06 Nov 2026.

30 Mar 2020 at ₹184.68Bought
541 shares₹1 lakh bought
5,410 sharesShares after split(s)
₹36,49,315 (37x, 01 Oct 2024)Peak value in the 5y window
₹1,14,421 (7 payouts)Dividends received
₹33,52,307 (-8% from that peak)Value on 06 Nov 2026

The journey of ₹1 lakh

When the ₹1 lakh crossed each level
LevelDateMonths after buying
₹2 lakh04 Jun 20203
₹5 lakh22 Jan 202110
₹10 lakh05 May 202114
₹25 lakh08 Dec 202121
Key points
PointDateShare priceValue of the ₹1 lakh
Buy30 Mar 2020₹184.68₹1,00,000
Peak in the 5y window (the reel)01 Oct 2024₹674.55₹36,49,315
Lowest after that high07 Apr 2026-₹16,83,051
Latest in our data06 Nov 2026₹619.65₹33,52,307

Splits: 26 Apr 2022: 10:1 split (each share became 10). 541 shares became 5,410. The price falls by the same ratio on the split day, so the value does not change. All prices here are the real traded prices.

3 lessons from this story

  1. Old songs, new money. Songs recorded decades ago earn again every time they play on reels, YouTube and streaming apps. That is what the market paid for.
  2. The ride was rough. From the high of ₹36,49,315 (01 Oct 2024) the value fell to ₹16,83,051 by 07 Apr 2026: -54%. The worst single day was -7.8% (12 May 2020).
  3. Compare with a safe option. The same ₹1 lakh in a 7% FD would be about ₹1,56,330 after 6.6 years. Dividends of ₹1,14,421 came on top of the share value.

3 questions to study any music or content company

  1. How big is the catalogue? A large library of old songs that people still play earns steady royalties for decades.
  2. Is royalty income growing every year? Check 5 years of revenue from licensing and streaming in the annual report, not one good quarter.
  3. How much is spent on new films and music - and does it earn back? New content is a costly bet. A few flops can eat the profit from the old catalogue.

⚠️ This is an old story with past data, picked after the fact. It is not a promise about the future and not a recommendation to buy, sell or hold this stock.

Data: Yahoo Finance daily prices for SAREGAMA.NS (split-adjusted; raw prices rebuilt from split events) and dividend events, 30 Mar 2020 to 06 Nov 2026. ₹1,00,000 at that day's close, whole shares only. FD at 7% a year, compounded. Split/demerger check passed.

🔗 Link to this answer

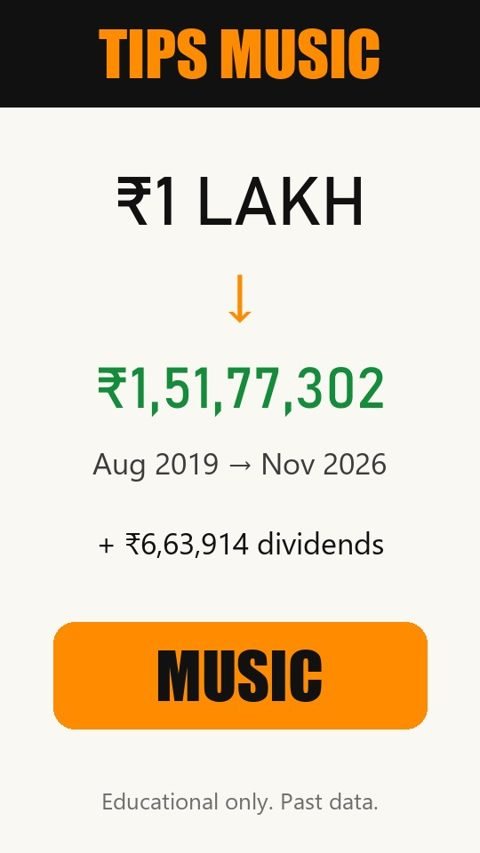
Tips Music: ₹1 lakh to ₹1.5 crore, and the Royalty Business Checklist▶
MUSIC18 Nov 2026

Tips Music: ₹1 lakh to ₹1.5 crore, and the Royalty Business Checklist

₹1 lakh in Aug 2019 became ₹1,51,77,302 by 06 Nov 2026, plus ₹6,63,914 in dividends. Full working + 7 questions to study any music or content company.

▶ Watch reel

The reel told the Tips Music story: the company that owns many of the old and new Bollywood songs you hear on reels. Below is the full working, and the Royalty Business Checklist promised in the caption. Data: 08 Aug 2019 to 06 Nov 2026.

08 Aug 2019 at ₹50.67Bought
1,973 shares₹1 lakh bought
19,730 sharesAfter the 10:1 split (21 Apr 2023)
₹1,52,33,533 (152x)5-year peak value
₹6,63,914 (14 payouts)Dividends received
₹1,51,77,302Value on 06 Nov 2026

The journey of ₹1 lakh

When the ₹1 lakh crossed each level
LevelDateMonths after buying
₹2 lakh28 Jan 20205
₹5 lakh10 Sep 202013
₹10 lakh28 Apr 202120
₹25 lakh29 Jun 202122
₹50 lakh28 Jun 202346
₹1 crore26 Feb 202454
Key points
PointDateShare priceValue of the ₹1 lakh
Buy08 Aug 2019₹50.67₹1,00,000
5-year peak (shown in the reel)19 Aug 2024₹772.10₹1,52,33,533
Highest value06 Nov 2024₹937.25₹1,84,91,942
Lowest after that high10 Nov 2025-₹95,57,212
Latest in our data06 Nov 2026₹769.25₹1,51,77,302

How the share count works: in 21 Apr 2023 each share became 10 shares (10:1 split). The share price dropped to about one-tenth the same day, so the value did not change. 1,973 shares × 10 = 19,730 shares. Always compare prices after adjusting for splits.

3 lessons from this story

  1. Make once, sell again and again. A song is recorded once, but it keeps earning every time it is played on reels, YouTube and streaming. Businesses like this can compound for a long time.
  2. Even winners fall hard. From the high of ₹1,84,91,942 (06 Nov 2024), the value fell to ₹95,57,212 by 10 Nov 2025: a fall of 48%. The worst single day was -15.1% (15 Sep 2020). Holding through that is the hard part.
  3. Count dividends separately. The headline number is the share value. On top of it, 14 dividends paid ₹6,63,914 in total. The same ₹1 lakh in a 7% FD would have been about ₹1,63,285 after 7.2 years.

Royalty Business Checklist: 7 questions to study any music or content company

  1. Does the company own its content, or rent it? Owned songs can earn for decades. Licensed rights can expire or get costly to renew.
  2. How big and how old is the catalogue? A large library of old songs that people still play gives steadier income than a few new hits.
  3. Who pays it? If most income comes from a few platforms (YouTube, streaming apps, social media), what happens if one of them cuts rates or stops paying?
  4. Is royalty income growing every year? Check the revenue and profit trend for 5 years in the annual report, not just one good quarter.
  5. How much does new content cost, and does it earn back? New films and albums can be expensive bets. Look at how much is spent and how often it works.
  6. Is the price already expecting too much? A good business can still be a bad buy at a very high price. This stock fell about half in a year while the business kept running.
  7. Is the money real? Profit should turn into cash and dividends over time, not only into numbers on paper.

⚠️ This is an old story with past data. It is not a promise that the future will be the same, and not a recommendation to buy, sell or hold this stock. The value fell about half within a year on the way.

Data: Yahoo Finance daily prices for TIPSMUSIC.NS (split-adjusted; raw prices rebuilt using the 10:1 split of 21 Apr 2023) and its dividend events, 08 Aug 2019 to 06 Nov 2026. ₹1,00,000 at that day's close, whole shares only. FD at 7% a year, compounded. Split/demerger check passed.

🔗 Link to this answer

November 2026 Dividend Calendar (Nifty 500) + how to read dividend yield▶
DIVIDEND18 Nov 2026

November 2026 Dividend Calendar (Nifty 500) + how to read dividend yield

The reel asked: which companies are paying a dividend this month? Below is every Nifty 500 company with a dividend ex-date in November 2026 (BSE corporate actions, announced up to 18 Nov 2026).

▶ Watch reel

The reel asked: which companies are paying a dividend this month? Below is every Nifty 500 company with a dividend ex-date in November 2026 (BSE corporate actions, announced up to 18 Nov 2026).

55Nifty 500 companies, Nov ex-date
7Of these, in the Nifty 50
6On or after 18 Nov

Ex-date: if you buy the share on or after this day, you do not get this dividend. Record date: the company pays the shareholders on its list on this day. This list is information only, not a recommendation to buy any stock.

Coming up (18 Nov to 30 Nov)
Ex-dateCompanyDividend / shareRecord date
18 NovManappuram Finance Ltd. (MANAPPURAM)₹118 Nov 2026
18 NovPage Industries Ltd. (PAGEIND)₹15018 Nov 2026
18 NovTD Power Systems Ltd. (TDPOWERSYS)₹0.6518 Nov 2026
19 NovNATCO Pharma Ltd. (NATCOPHARM)₹1.2519 Nov 2026
20 NovAshok Leyland Ltd. (ASHOKLEY)₹120 Nov 2026
20 NovOil India Ltd. (OIL)₹720 Nov 2026
All of November 2026 (55 companies)
Ex-dateCompanyDividend / shareRecord date
02 NovColgate Palmolive (India) Ltd. (COLPAL)₹2402 Nov 2026
03 NovGravita India Ltd. (GRAVITA)₹7.703 Nov 2026
03 NovInfosys Ltd. (INFY)₹2603 Nov 2026Nifty 50
03 NovMazagoan Dock Shipbuilders Ltd. (MAZDOCK)₹503 Nov 2026
03 NovR R Kabel Ltd. (RRKABEL)₹6.503 Nov 2026
04 NovAsian Paints Ltd. (ASIANPAINT)₹5.7504 Nov 2026Nifty 50
04 NovCoal India Ltd. (COALINDIA)₹10.2504 Nov 2026Nifty 50
04 NovGodrej Consumer Products Ltd. (GODREJCP)₹504 Nov 2026
04 NovPrivi Speciality Chemicals Ltd. (PRIVISCL)₹504 Nov 2026
05 NovBirlasoft Ltd. (BSOFT)₹305 Nov 2026
05 NovEngineers India Ltd. (ENGINERSIN)₹1.505 Nov 2026
05 NovNavin Fluorine International Ltd. (NAVINFLUOR)₹805 Nov 2026
05 NovSun TV Network Ltd. (SUNTV)₹3.7505 Nov 2026
05 NovVarun Beverages Ltd. (VBL)₹0.505 Nov 2026
06 NovAmara Raja Energy & Mobility Ltd. (ARE&M)₹4.306 Nov 2026
06 NovGabriel India Ltd. (GABRIEL)₹2.1506 Nov 2026
06 NovInfo Edge (India) Ltd. (NAUKRI)₹306 Nov 2026
06 NovLaurus Labs Ltd. (LAURUSLABS)₹106 Nov 2026
06 NovNTPC Ltd. (NTPC)₹306 Nov 2026Nifty 50
06 NovNational Aluminium Co. Ltd. (NATIONALUM)₹4.506 Nov 2026
06 NovPetronet LNG Ltd. (PETRONET)₹706 Nov 2026
06 NovPower Grid Corporation of India Ltd. (POWERGRID)₹306 Nov 2026Nifty 50
06 NovRamkrishna Forgings Ltd. (RKFORGE)₹206 Nov 2026
09 NovDabur India Ltd. (DABUR)₹3.510 Nov 2026
11 NovAurobindo Pharma Ltd. (AUROPHARMA)₹711 Nov 2026
11 NovBalkrishna Industries Ltd. (BALKRISIND)₹411 Nov 2026
11 NovBalrampur Chini Mills Ltd. (BALRAMCHIN)₹411 Nov 2026
11 NovChambal Fertilizers & Chemicals Ltd. (CHAMBLFERT)₹511 Nov 2026
11 NovContainer Corporation of India Ltd. (CONCOR)₹1.911 Nov 2026
11 NovDr. Lal Path Labs Ltd. (LALPATHLAB)₹511 Nov 2026
11 NovHousing & Urban Development Corporation Ltd. (HUDCO)₹1.3511 Nov 2026
11 NovJM Financial Ltd. (JMFINANCIL)₹1.6511 Nov 2026
11 NovNBCC (India) Ltd. (NBCC)₹0.2511 Nov 2026
11 NovPremier Energies Ltd. (PREMIERENE)₹0.511 Nov 2026
11 NovRITES Ltd. (RITES)₹1.911 Nov 2026
12 NovGodfrey Phillips India Ltd. (GODFRYPHLP)₹1012 Nov 2026
12 NovHindustan Unilever Ltd. (HINDUNILVR)₹1912 Nov 2026Nifty 50
12 NovIRB Infrastructure Developers Ltd. (IRB)₹0.0512 Nov 2026
12 NovNLC India Ltd. (NLCINDIA)₹1.512 Nov 2026
12 NovOil & Natural Gas Corporation Ltd. (ONGC)₹812 Nov 2026Nifty 50
13 NovAptus Value Housing Finance India Ltd. (APTUS)₹213 Nov 2026
13 NovAstral Ltd. (ASTRAL)₹1.513 Nov 2026
13 NovComputer Age Management Services Ltd. (CAMS)₹3.2513 Nov 2026
13 NovEmami Ltd. (EMAMILTD)₹513 Nov 2026
13 NovGreat Eastern Shipping Co. Ltd. (GESHIP)₹14.413 Nov 2026
16 NovCochin Shipyard Ltd. (COCHINSHIP)₹316 Nov 2026
16 NovShipping Corporation of India Ltd. (SCI)₹416 Nov 2026
17 NovMRF Ltd. (MRF)₹317 Nov 2026
17 NovPower Finance Corporation Ltd. (PFC)₹4.117 Nov 2026
18 NovManappuram Finance Ltd. (MANAPPURAM)₹118 Nov 2026
18 NovPage Industries Ltd. (PAGEIND)₹15018 Nov 2026
18 NovTD Power Systems Ltd. (TDPOWERSYS)₹0.6518 Nov 2026
19 NovNATCO Pharma Ltd. (NATCOPHARM)₹1.2519 Nov 2026
20 NovAshok Leyland Ltd. (ASHOKLEY)₹120 Nov 2026
20 NovOil India Ltd. (OIL)₹720 Nov 2026

What is dividend yield?

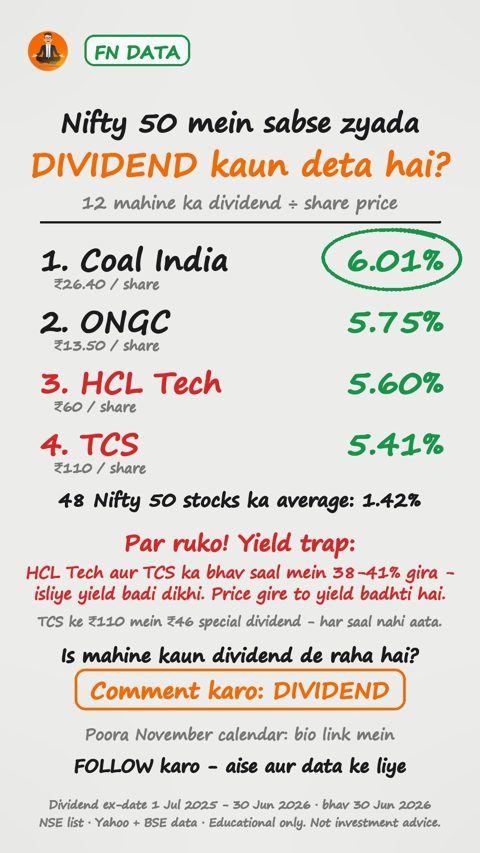
The reel showed the 4 Nifty 50 stocks with the highest dividend yield. Here is how that number is calculated, and when it can mislead you.

Formula

Dividend yield = total dividend in the last 12 months ÷ share price × 100. Example: Coal India paid ₹26.40 in 12 months and the price on 30 Jun 2026 was ₹439.05. ₹26.40 ÷ ₹439.05 = 6.01%.

1.42%Average of 48 Nifty 50 stocks
6.01%Highest (Coal India)
Top 10 by dividend yield (dividend ex-dates 1 Jul 2025 - 30 Jun 2026, price on 30 Jun 2026)
#Stock (NSE)Dividend / sharePriceYield
1COALINDIA₹26.40₹439.056.01%
2ONGC₹13.50₹234.905.75%
3HCLTECH₹60.00₹1,071.805.60%
4TCS₹110.00₹2,031.505.41%
5ITC₹14.50₹286.955.05%
6INFY₹48.00₹1,000.404.80%
7TECHM₹45.00₹1,404.703.20%
8POWERGRID₹9.00₹286.303.14%
9NTPC₹8.85₹356.652.48%
10TATASTEEL₹4.00₹188.062.13%

3 checks before you trust a high yield

  1. Did the price fall? A falling price pushes the yield up. This year HCL Tech fell 38% and TCS fell 41%, which is why their yields looked high. They paid dividends, but the price loss was far bigger.
  2. Was it a special dividend? TCS's ₹110 included a one-time ₹46 special dividend. Without it, the yield is 3.15%. Special dividends don't come every year.
  3. The ex-date trap. On the ex-date, the share price usually opens lower by roughly the dividend amount. Buying just before the ex-date only for the dividend is not 'free money', and dividends are taxed too.

⚠️ Dividends are not fixed: a company can cut or stop them. The price loss can be bigger than the dividend. This is not a recommendation to buy any stock.

Data: Calendar: BSE corporate actions (dividend, equity, ex-date Nov 2026) as on 18 Nov 2026, matched to the NSE Nifty 500 list; later announcements are not in it yet. Yield: NSE Nifty 50 list (18 Nov 2026); dividends (ex-date 1 Jul 2025 - 30 Jun 2026) and prices (30 Jun 2026 close) from Yahoo Finance, top 4 matched with BSE corporate actions; TMPV and TRENT removed by the split/demerger check.

🔗 Link to this answer

Tanla Platforms: ₹1 lakh to ₹71.0 lakh then down 68% - and 3 questions to ask▶
OTP17 Nov 2026

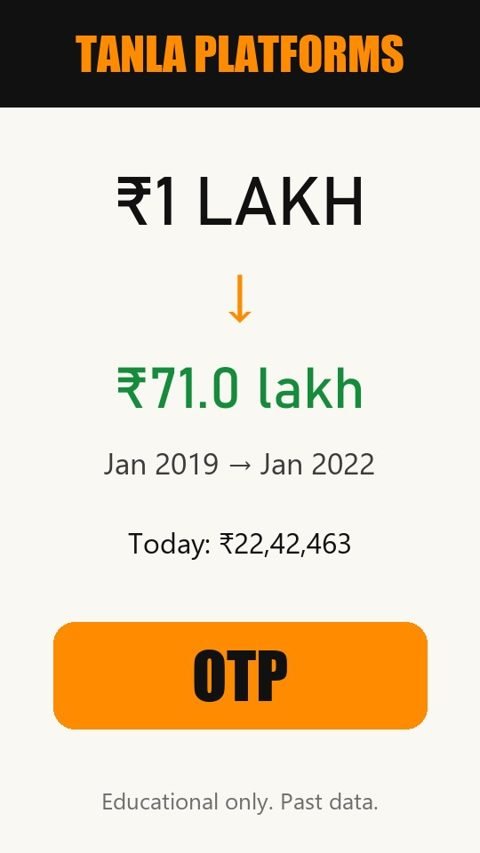
Tanla Platforms: ₹1 lakh to ₹71.0 lakh then down 68% - and 3 questions to ask

₹1 lakh in Jan 2019 reached ₹70,96,371 at its 3y peak (Jan 2022); on 06 Nov 2026 it was ₹22,42,463. Full working + 3 questions when a share rises 70x in 3 years.

▶ Watch reel

The reel told the Tanla Platforms story: a company that sends business SMS such as bank OTPs and alerts. Below is the full working and the 3 questions from the pinned comment, explained. Data: 14 Jan 2019 to 06 Nov 2026.

14 Jan 2019 at ₹29.05Bought
3,442 shares₹1 lakh bought
₹70,96,371 (71x, 14 Jan 2022)Peak value in the 3y window
₹1,93,957 (12 payouts)Dividends received
₹22,42,463 (-68% from that peak)Value on 06 Nov 2026

The journey of ₹1 lakh

When the ₹1 lakh crossed each level
LevelDateMonths after buying
₹2 lakh04 Jun 20195
₹5 lakh07 Aug 202019
₹10 lakh30 Sep 202020
₹25 lakh04 Dec 202023
₹50 lakh18 Nov 202134
Key points
PointDateShare priceValue of the ₹1 lakh
Buy14 Jan 2019₹29.05₹1,00,000
Peak in the 3y window (the reel)14 Jan 2022₹2,061.70₹70,96,371
Lowest after that high30 Mar 2026-₹12,99,183
Latest in our data06 Nov 2026₹651.50₹22,42,463

3 lessons from this story

  1. A great run can reverse. The same ₹1 lakh that touched its peak is now far lower. A price that rises much faster than the business can fall just as fast.
  2. The ride was rough. From the high of ₹70,96,371 (14 Jan 2022) the value fell to ₹12,99,183 by 30 Mar 2026: -82%. The worst single day was -20.0% (26 Jul 2022).
  3. Compare with a safe option. The same ₹1 lakh in a 7% FD would be about ₹1,69,636 after 7.8 years. Dividends of ₹1,93,957 came on top of the share value.

3 questions when a share rises 70x in 3 years

  1. Did earnings grow as fast as the share price? If the price rose 70x but profit rose far less, the price was running on hope.
  2. What if one big customer leaves? Business messaging depends on a few large telecom and platform partners. Check how much revenue comes from the top customers.
  3. Is it easy for a new competitor to enter? In this story that question mattered most: messaging is a field where prices can be cut and new players can come in.

⚠️ This is an old story with past data, picked after the fact. It is not a promise about the future and not a recommendation to buy, sell or hold this stock.

Data: Yahoo Finance daily prices for TANLA.NS (split-adjusted; raw prices rebuilt from split events) and dividend events, 14 Jan 2019 to 06 Nov 2026. ₹1,00,000 at that day's close, whole shares only. FD at 7% a year, compounded. Split/demerger check passed.

🔗 Link to this answer

Run or stay when the market crashes? All 27 Nifty crash days, with data▶
CRASH17 Nov 2026

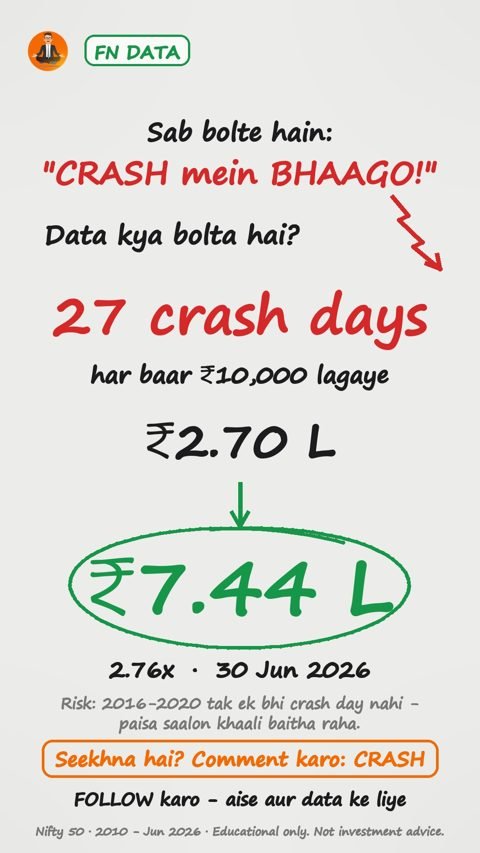
Run or stay when the market crashes? All 27 Nifty crash days, with data

The reel asked: what happens when the market falls 3% or more in a single day? Here is the full working, Jan 2010 to 30 Jun 2026.

▶ Watch reel

The reel asked: what happens when the market falls 3% or more in a single day? Here is the full working, Jan 2010 to 30 Jun 2026.

27Crash days (-3% or worse)
₹2.70 lakh₹10,000 each day = total invested
₹7,44,383Value on 30 Jun 2026
2.76xMultiple

3 lessons from the data

  1. Crash days are rare. Only 27 days in 16.5 years. Year by year: 2010: 1, 2011: 2, 2013: 3, 2015: 1, 2016: 1, 2020: 12, 2021: 2, 2022: 2, 2024: 1, 2025: 1, 2026: 1.
  2. They come in clusters. 2020 alone had 12 crash days (Covid). The biggest fall was on 23 Mar 2020: -13.0% in one day.
  3. Long quiet spells happen too. From 11 Feb 2016 to 28 Feb 2020, 1,478 days (4 years) passed without a single crash day. Money waiting for this rule would have sat idle for years.
Every crash day: what ₹10,000 invested that day was worth on 30 Jun 2026
DateNifty that dayNifty closeValue of ₹10,000 (30 Jun 2026)
27 Jan 2010-3.09%4,853.10₹49,176
24 Feb 2011-3.21%5,262.70₹45,349
22 Sep 2011-4.08%4,923.65₹48,472
16 Aug 2013-4.08%5,507.85₹43,330
27 Aug 2013-3.45%5,287.45₹45,137
03 Sep 2013-3.77%5,341.45₹44,680
24 Aug 2015-5.92%7,809.00₹30,562
11 Feb 2016-3.32%6,976.35₹34,210
28 Feb 2020-3.71%11,201.75₹21,305
09 Mar 2020-4.90%10,451.45₹22,835
12 Mar 2020-8.30%9,590.15₹24,886
16 Mar 2020-7.61%9,197.40₹25,948
18 Mar 2020-5.56%8,468.80₹28,181
23 Mar 2020-12.98%7,610.25₹31,360
30 Mar 2020-4.38%8,281.10₹28,820
01 Apr 2020-4.00%8,253.80₹28,915
21 Apr 2020-3.03%8,981.45₹26,572
04 May 2020-5.74%9,293.50₹25,680
18 May 2020-3.43%8,823.25₹27,049
21 Dec 2020-3.14%13,328.40₹17,906
26 Feb 2021-3.76%14,529.15₹16,426
12 Apr 2021-3.53%14,310.80₹16,677
14 Feb 2022-3.06%16,842.80₹14,170
24 Feb 2022-4.78%16,247.95₹14,688
04 Jun 2024-5.93%21,884.50₹10,905
07 Apr 2025-3.24%22,161.60₹10,769
19 Mar 2026-3.26%23,002.15₹10,375

Best: the 27 Jan 2010 ₹10,000 became ₹49,176. Lowest: the 19 Mar 2026 one became ₹10,375.

⚠️ This is past data, not a promise about the future. Fear is highest on crash days, and the next crash may not recover like the last ones. Dividends, costs and tax are not included.

Data: Nifty 50 price index daily close (Yahoo Finance), 1 Jan 2010 - 30 Jun 2026; rule: close ≤ -3% vs previous close, ₹10,000 at that day's close, valued at the 30 Jun 2026 close of 23,865.75.

🔗 Link to this answer

Angel One: ₹1 lakh to ₹16.9 lakh and the 3 questions to study any broker▶
BROKER17 Nov 2026

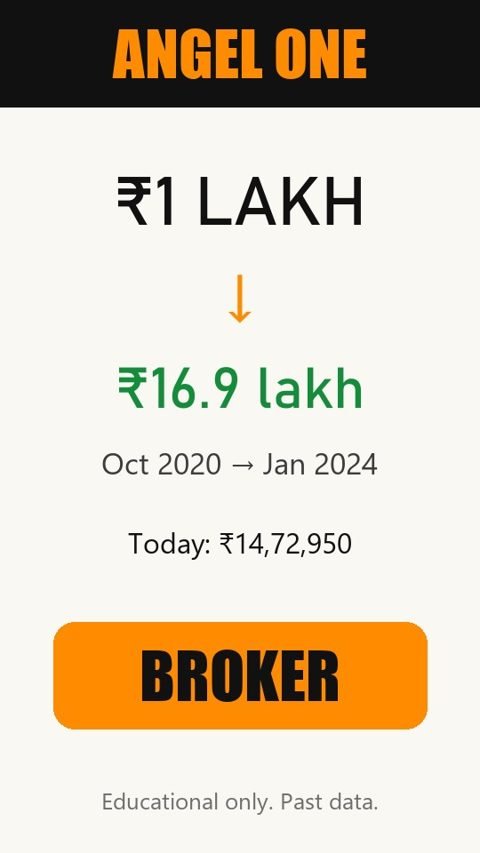
Angel One: ₹1 lakh to ₹16.9 lakh and the 3 questions to study any broker

₹1 lakh in Oct 2020 reached ₹16,93,514 at its 5y peak (Jan 2024); on 06 Nov 2026 it was ₹14,72,950. Full working + 3 questions to study any broker or trading-app company.

▶ Watch reel

The reel told the Angel One story: a stock broker and trading app: it earns when people trade, win or lose. Below is the full working and the 3 questions from the pinned comment, explained. Data: 20 Oct 2020 to 06 Nov 2026.

20 Oct 2020 at ₹224.65Bought
445 shares₹1 lakh bought
4,450 sharesShares after split(s)
₹16,93,514 (17x, 08 Jan 2024)Peak value in the 5y window
₹1,00,459 (22 payouts)Dividends received
₹14,72,950 (-13% from that peak)Value on 06 Nov 2026

The journey of ₹1 lakh

When the ₹1 lakh crossed each level
LevelDateMonths after buying
₹2 lakh06 May 20217
₹5 lakh16 Jul 20219
₹10 lakh20 Oct 202336
Key points
PointDateShare priceValue of the ₹1 lakh
Buy20 Oct 2020₹224.65₹1,00,000
Peak in the 5y window (the reel)08 Jan 2024₹3,805.65₹16,93,514
Lowest after that high13 Mar 2025-₹8,69,308
Latest in our data06 Nov 2026₹331.00₹14,72,950

Splits: 26 Feb 2026: 10:1 split (each share became 10). 445 shares became 4,450. The price falls by the same ratio on the split day, so the value does not change. All prices here are the real traded prices.

3 lessons from this story

  1. The business depends on market mood. Angel One earns from trading activity. Its best years came with the 2020-21 rush of new traders, and that kind of activity rises and falls with the market.
  2. The ride was rough. From the high of ₹16,93,514 (08 Jan 2024) the value fell to ₹8,69,308 by 13 Mar 2025: -49%. The worst single day was -12.8% (04 Jun 2024).
  3. Compare with a safe option. The same ₹1 lakh in a 7% FD would be about ₹1,50,532 after 6.0 years. Dividends of ₹1,00,459 came on top of the share value.

3 questions to study any broker or trading-app company

  1. Where does the money come from - orders or interest? A broker that earns mostly per order depends on how much people trade. When markets go quiet, that income falls fast.
  2. Are new accounts growing or slowing? Look at the monthly new-client numbers. The 2020-21 boom brought millions of first-time traders; growth like that does not last forever.
  3. Has the regulator changed the rules on charges or F&O? SEBI rule changes on fees and derivatives trading can cut a broker's income in one go.

⚠️ This is an old story with past data, picked after the fact. It is not a promise about the future and not a recommendation to buy, sell or hold this stock.

Data: Yahoo Finance daily prices for ANGELONE.NS (split-adjusted; raw prices rebuilt from split events) and dividend events, 20 Oct 2020 to 06 Nov 2026. ₹1,00,000 at that day's close, whole shares only. FD at 7% a year, compounded. Split/demerger check passed.

🔗 Link to this answer

Suzlon: ₹5.80 to ₹80 - and what a rights issue means for your shares▶
RIGHTS11 Nov 2026

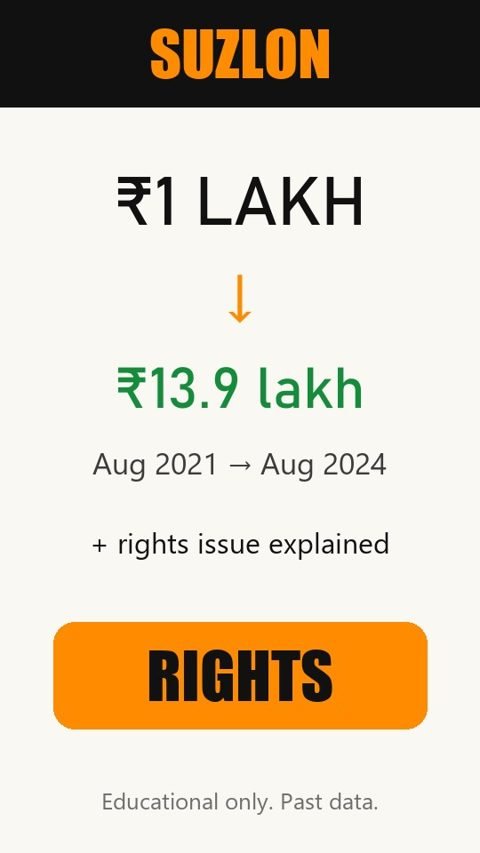
Suzlon: ₹5.80 to ₹80 - and what a rights issue means for your shares

₹1 lakh at ₹5.80 (20 Aug 2021) became ₹13,92,900 by 13 Aug 2024 - ₹17,24,543 if you also took the 2022 rights shares. Full working + rights issue explained.

▶ Watch reel

The reel told the Suzlon story: the wind-turbine maker everyone had written off because of its debt. In October 2022 it raised money through a rights issue, and many shareholders ignored that message. Below is the full working, with and without the rights shares.

20 Aug 2021 at ₹5.80Bought
17,241 shares₹1 lakh bought
5 new for every 21 held, at ₹5 (ex-date 03 Oct 2022)Rights offer
4,105 new shares for ₹20,525 extraRights shares
₹13,92,900 without rights · ₹17,24,543 with rightsValue on 13 Aug 2024
₹6,07,745 without · ₹7,52,446 with rightsValue on 02 Nov 2026
Took the rights or ignored them?
SharesMoney put inValue on 13 Aug 2024Value on 02 Nov 2026
Ignored the rights17,241₹1,00,000₹13,92,900₹6,07,745
Took the rights21,346₹1,20,525₹17,24,543₹7,52,446

What is a rights issue? The company offers its existing shareholders new shares, usually below the market price, in a fixed ratio (here 5 for every 21). You can apply, sell the right (renounce) while it trades, or ignore it. If you ignore it, the offer lapses and your share of the company becomes smaller. The message comes from your broker / registrar - check the dates, because the window is short.

3 lessons from this story

  1. Read corporate-action messages. The rights offer was worth acting on here. Ignoring it left money on the table.
  2. The fall came first. Inside this period the value fell 52% between 17 Jan 2022 and 28 Jul 2022. It crossed 10x only on 24 Jun 2024.
  3. Peaks don't stay. By 02 Nov 2026 the same shares were worth ₹6,07,745, less than half the 2024 value. A 7% FD over the 3 years would be about ₹1,22,351.

3 questions when you get a rights-issue message

  1. Why is the company raising money? To repay debt or grow is different from covering losses. Read the offer letter's 'objects of the issue'.
  2. What is the price versus the market price? A big discount makes the right valuable - even if you don't want more shares, you may be able to sell the right.
  3. What are the dates? Note the record date, the last day to apply and the last day the rights trade. Missing them means the offer simply lapses.

⚠️ This is one of the best runs out of about 2,000 stocks, picked after the fact. Rights issues can also come from weak companies. Past data only - not a recommendation to buy, sell or hold, or to apply in any rights issue.

Data: NSE bhavcopy closing prices and NSE corporate-actions list (project research sheet "Batch 3 - stock research.md"); biggest fall and 10x date from Yahoo Finance daily closes. ₹1,00,000 at the entry close, whole shares only. FD at 7% a year. Today's value uses the 2 Nov 2026 close. Rights ratio, price and ex-date from NSE corporate actions.

🔗 Link to this answer

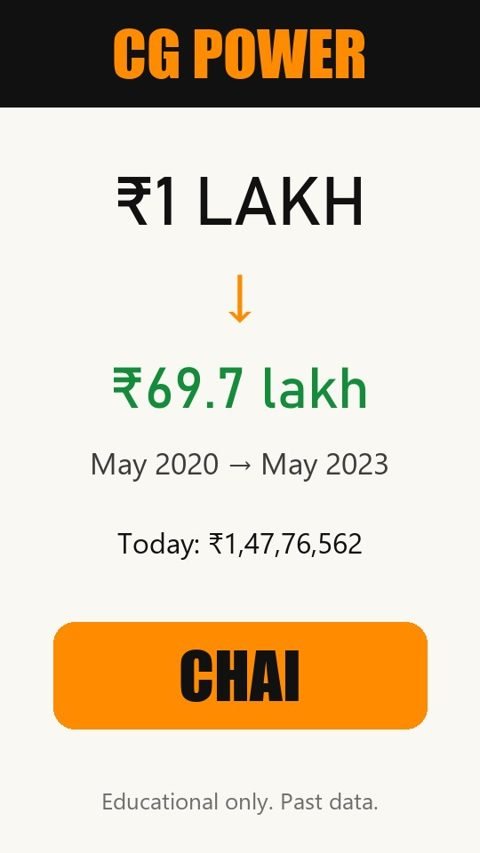
CG Power: a share cheaper than cutting chai - ₹1 lakh to ₹69.7 lakh in 3 years▶
CHAI04 Nov 2026

CG Power: a share cheaper than cutting chai - ₹1 lakh to ₹69.7 lakh in 3 years

₹1 lakh at ₹5.55 (26 May 2020) became ₹69,72,966 by 26 May 2023; on 2 Nov 2026 the same shares were worth ₹1,47,76,562. Full working + 3 questions for a turnaround story.

▶ Watch reel

The reel asked: can a share cheaper than a cutting chai make you a crorepati? This is CG Power, a maker of motors, transformers and railway equipment. In 2019 the company was hit by fraud allegations and its chairman was removed. In 2020 the Murugappa group's Tube Investments put in money and took control. The ₹1 lakh below was put in before that takeover.

26 May 2020 at ₹5.55Bought
18,018 shares₹1 lakh bought
26 May 2023 at ₹387.003 years later
₹69,72,966 (69.7x)Value then
₹27,027 (₹1.5 a share, 15 Mar 2023)Dividend in those 3 years
₹1,47,76,562 at ₹820.10Value on 02 Nov 2026
Key points
PointDateShare priceValue of the ₹1 lakh
Buy26 May 2020₹5.55₹1,00,000
Crossed 10x23 Feb 2021-₹10 lakh+
3-year mark (the reel)26 May 2023₹387.00₹69,72,966
Latest in our data02 Nov 2026₹820.10₹1,47,76,562

No split, bonus or rights issue in these years, so 18,018 shares stayed 18,018 shares. Dividends after May 2023 added another ₹70,270.

3 lessons from this story

  1. A cheap price is not the reason. ₹5.55 was cheap because the company was in deep trouble. The share rose because a strong new owner fixed the business, not because the price was low.
  2. It still shook people out. Even on the way up, the value fell 25% between 07 Jul 2020 and 22 Jul 2020. Many sold there.
  3. Compare with a safe option. The same ₹1 lakh in a 7% FD for 3 years would be about ₹1,22,487.

3 questions for any turnaround story

  1. Who is the new owner, and how much of their own money did they put in? A turnaround needs someone with money and a record of running businesses.
  2. Is the old problem actually closed? Check whether the debt, the legal cases and the bad parts of the business are settled, not just hidden.
  3. Are sales and profit improving quarter after quarter? Hope moves a share for a while; numbers keep it there.

⚠️ This is one of the best runs out of about 2,000 stocks, picked after the fact; most stocks that look cheap and troubled never recover. Past data only - not a recommendation to buy, sell or hold.

Data: NSE bhavcopy closing prices and NSE corporate-actions list (project research sheet "Batch 3 - stock research.md"); biggest fall and 10x date from Yahoo Finance daily closes. ₹1,00,000 at the entry close, whole shares only. FD at 7% a year. Today's value uses the 2 Nov 2026 close.

🔗 Link to this answer

For education only. Nothing here is advice to buy, sell or hold any stock. All numbers come from past data, and past performance does not guarantee future results. Financial Nirvana is not a SEBI-registered investment adviser; please consult one before making decisions with your money.

Last updated: 20 Nov 2026, 04:44 PM IST · 12 answers